监控 Istio
监控是支持向微服务架构过渡的关键。
在 Istio 中,它默认就提供监控微服务之间的流量的功能。 您可以使用 Istio Dashboard 来实时监控您的微服务。
Istio 集成了开箱即用的 Prometheus 的时序数据库和监控系统。 Prometheus 收集了各种流量相关的指标, 并为其提供丰富的查询语言。
请看下面几个 Prometheus 查询 Istio-related 的例子。
通过 http://my-istio-logs-database.io 访问 Prometheus UI 界面。(这
my-istio-logs-database.ioURL 在您之前配置的/etc/hosts文件中)。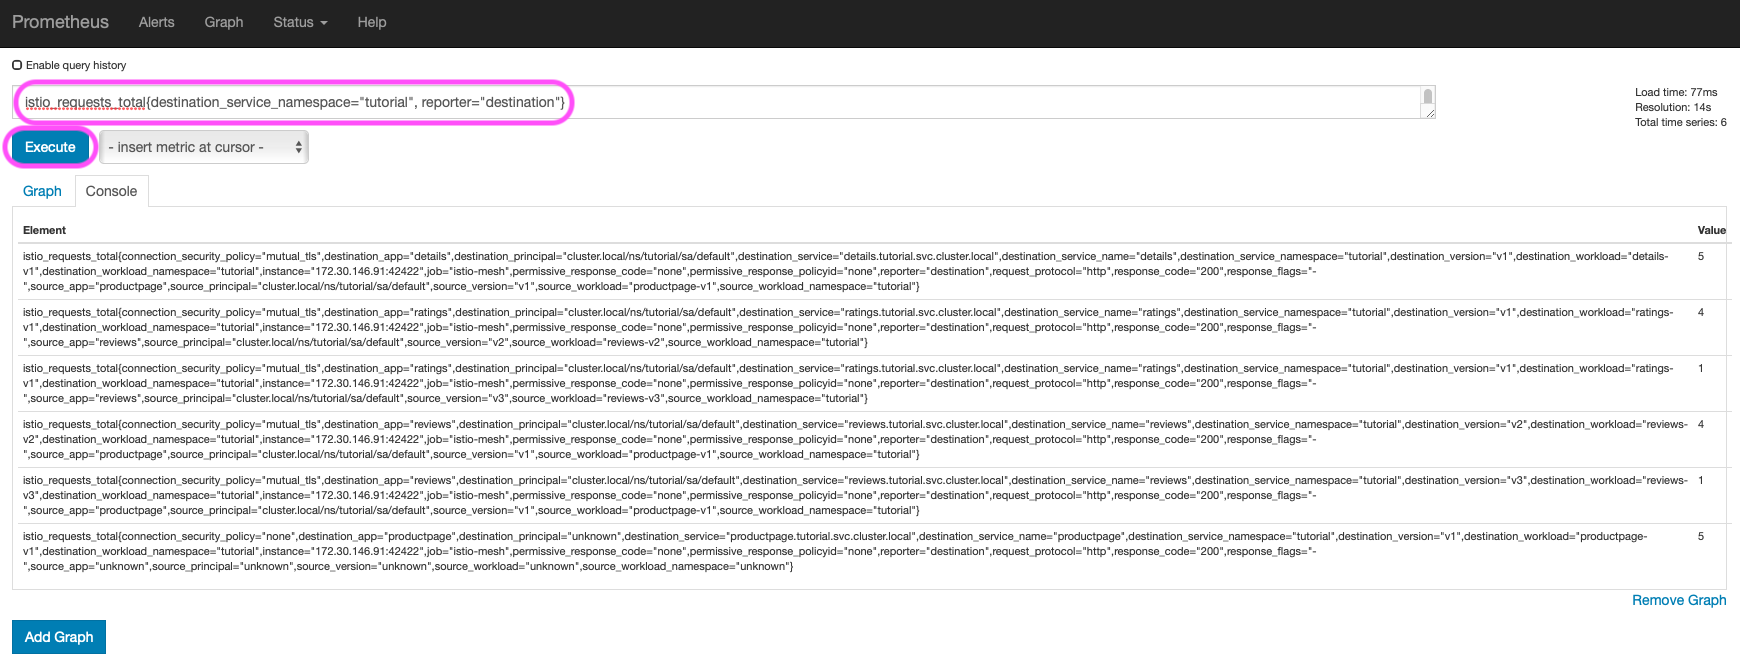
Prometheus Query UI 在 Expression 输入框中运行以下示例查询。按下 Execute 按钮,在 Console 中查看查询结果。这个查询使用
tutorial作为应用的命名空间,您可以替换成您自己的命名空间。 在查询数据时,为了能够得到更棒的效果,请运行前面步骤中描述的实时流量模拟器。查询命名空间的所有请求:
istio_requests_total{destination_service_namespace="tutorial", reporter="destination"}查询命名空间请求的总和:
sum(istio_requests_total{destination_service_namespace="tutorial", reporter="destination"})查询
reviews微服务的请求:istio_requests_total{destination_service_namespace="tutorial", reporter="destination",destination_service_name="reviews"}在过去5分钟内,
reviews微服务实例中的所有请求的请求速率:rate(istio_requests_total{destination_service_namespace="tutorial", reporter="destination",destination_service_name="reviews"}[5m])
上面使用的请求采用 istio_requests_total 指标,这是一个标准的 Istio 指标。
您可以观察其他指标,特别是 Envoy(Envoy
是 Istio 的 Sidecar 代理)。您可以在 insert metric at cursor
下拉菜单的看到收集的数据记录。
下一步
祝贺完成本教程!
通过这些 demo 安装任务是初学者进一步了解 Istio 的方式:
在您自定义 Istio 产品之前,可以先了解这些资源:
加入 Istio 社区
我们欢迎您通过加入 Istio 社区 提出并反馈问题。