OpenCensus Agent
After completing this task, you will understand how to have your application participate in tracing with the OpenCensus Agent, export those traces to the OpenTelemetry collector, and have the OpenTelemetry collector export those spans to Jaeger.
To learn how Istio handles tracing, visit this task’s overview.
Before you begin
Setup Istio by following the instructions in the Installation guide.
Deploy the sleep sample app to use as a test source for sending requests. If you have automatic sidecar injection enabled, run the following command to deploy the sample app:
$ kubectl apply -f @samples/sleep/sleep.yaml@Otherwise, manually inject the sidecar before deploying the
sleepapplication with the following command:$ kubectl apply -f <(istioctl kube-inject -f @samples/sleep/sleep.yaml@)Set the
SOURCE_PODenvironment variable to the name of your source pod:$ export SOURCE_POD=$(kubectl get pod -l app=sleep -o jsonpath={.items..metadata.name})
Configure tracing
If you used an IstioOperator CR to install Istio, add the following field to your configuration:
apiVersion: install.istio.io/v1alpha1
kind: IstioOperator
spec:
    meshConfig:
        defaultProviders:
            tracing:
            - "opencensus"
        enableTracing: true
        extensionProviders:
        - name: "opencensus"
          opencensus:
              service: "opentelemetry-collector.istio-system.svc.cluster.local"
              port: 55678
              context:
              - W3C_TRACE_CONTEXT
With this configuration Istio is installed with OpenCensus Agent as the default tracer. Trace data will be sent to an OpenTelemetry backend.
By default, Istio’s OpenCensus Agent tracing will attempt to read and write 4 types of trace headers:
- B3,
- gRPC’s binary trace header,
- W3C Trace Context,
- and Cloud Trace Context.
If you supply multiple values, the proxy will attempt to read trace headers in the specified order, using the first one that successfully parsed and writing all headers. This permits interoperability between services that use different headers, e.g. one service that propagates B3 headers and one that propagates W3C Trace Context headers can participate in the same trace. In this example we only use W3C Trace Context.
In the default profile the sampling rate is 1%. Increase it to 100% using the Telemetry API:
$ kubectl apply -f - <<EOF
apiVersion: telemetry.istio.io/v1alpha1
kind: Telemetry
metadata:
  name: mesh-default
  namespace: istio-system
spec:
  tracing:
  - randomSamplingPercentage: 100.00
EOF
Deploy OpenTelemetry Collector
OpenTelemetry collector supports exporting traces to several backends by default in the core distribution. Other backends are available in the contrib distribution of OpenTelemetry collector.
Deploy and configure the collector to receive and export spans to the Jaeger instance:
$ kubectl apply -f - <<EOF
apiVersion: v1
kind: ConfigMap
metadata:
  name: opentelemetry-collector
  namespace: istio-system
  labels:
    app: opentelemetry-collector
data:
  config: |
    receivers:
      opencensus:
        endpoint: 0.0.0.0:55678
    processors:
      memory_limiter:
        limit_mib: 100
        spike_limit_mib: 10
        check_interval: 5s
    exporters:
      zipkin:
        # Export via zipkin for easy querying
        endpoint: http://zipkin.istio-system.svc:9411/api/v2/spans
      logging:
        loglevel: debug
    extensions:
      health_check:
        port: 13133
    service:
      extensions:
      - health_check
      pipelines:
        traces:
          receivers:
          - opencensus
          processors:
          - memory_limiter
          exporters:
          - zipkin
          - logging
---
apiVersion: v1
kind: Service
metadata:
  name: opentelemetry-collector
  namespace: istio-system
  labels:
    app: opentelemetry-collector
spec:
  type: ClusterIP
  selector:
    app: opentelemetry-collector
  ports:
    - name: grpc-opencensus
      port: 55678
      protocol: TCP
      targetPort: 55678
---
apiVersion: apps/v1
kind: Deployment
metadata:
  name: opentelemetry-collector
  namespace: istio-system
  labels:
    app: opentelemetry-collector
spec:
  replicas: 1
  selector:
    matchLabels:
      app: opentelemetry-collector
  template:
    metadata:
      labels:
        app: opentelemetry-collector
    spec:
      containers:
        - name: opentelemetry-collector
          image: "otel/opentelemetry-collector:0.49.0"
          imagePullPolicy: IfNotPresent
          command:
            - "/otelcol"
            - "--config=/conf/config.yaml"
          ports:
            - name: grpc-opencensus
              containerPort: 55678
              protocol: TCP
          volumeMounts:
            - name: opentelemetry-collector-config
              mountPath: /conf
          readinessProbe:
            httpGet:
              path: /
              port: 13133
          resources:
            requests:
              cpu: 40m
              memory: 100Mi
      volumes:
        - name: opentelemetry-collector-config
          configMap:
            name: opentelemetry-collector
            items:
              - key: config
                path: config.yaml
EOF
Access the dashboard
Remotely Accessing Telemetry Addons details how to configure access to the Istio addons through a gateway.
For testing (and temporary access), you may also use port-forwarding. Use the following, assuming you’ve deployed Jaeger to the istio-system namespace:
$ istioctl dashboard jaeger
Generating traces using the Bookinfo sample
When the Bookinfo application is up and running, access
http://$GATEWAY_URL/productpageone or more times to generate trace information.To see trace data, you must send requests to your service. The number of requests depends on Istio’s sampling rate and can be configured using the Telemetry API. With the default sampling rate of 1%, you need to send at least 100 requests before the first trace is visible. To send a 100 requests to the
productpageservice, use the following command:$ for i in $(seq 1 100); do curl -s -o /dev/null "http://$GATEWAY_URL/productpage"; doneFrom the left-hand pane of the dashboard, select
productpage.defaultfrom the Service drop-down list and click Find Traces: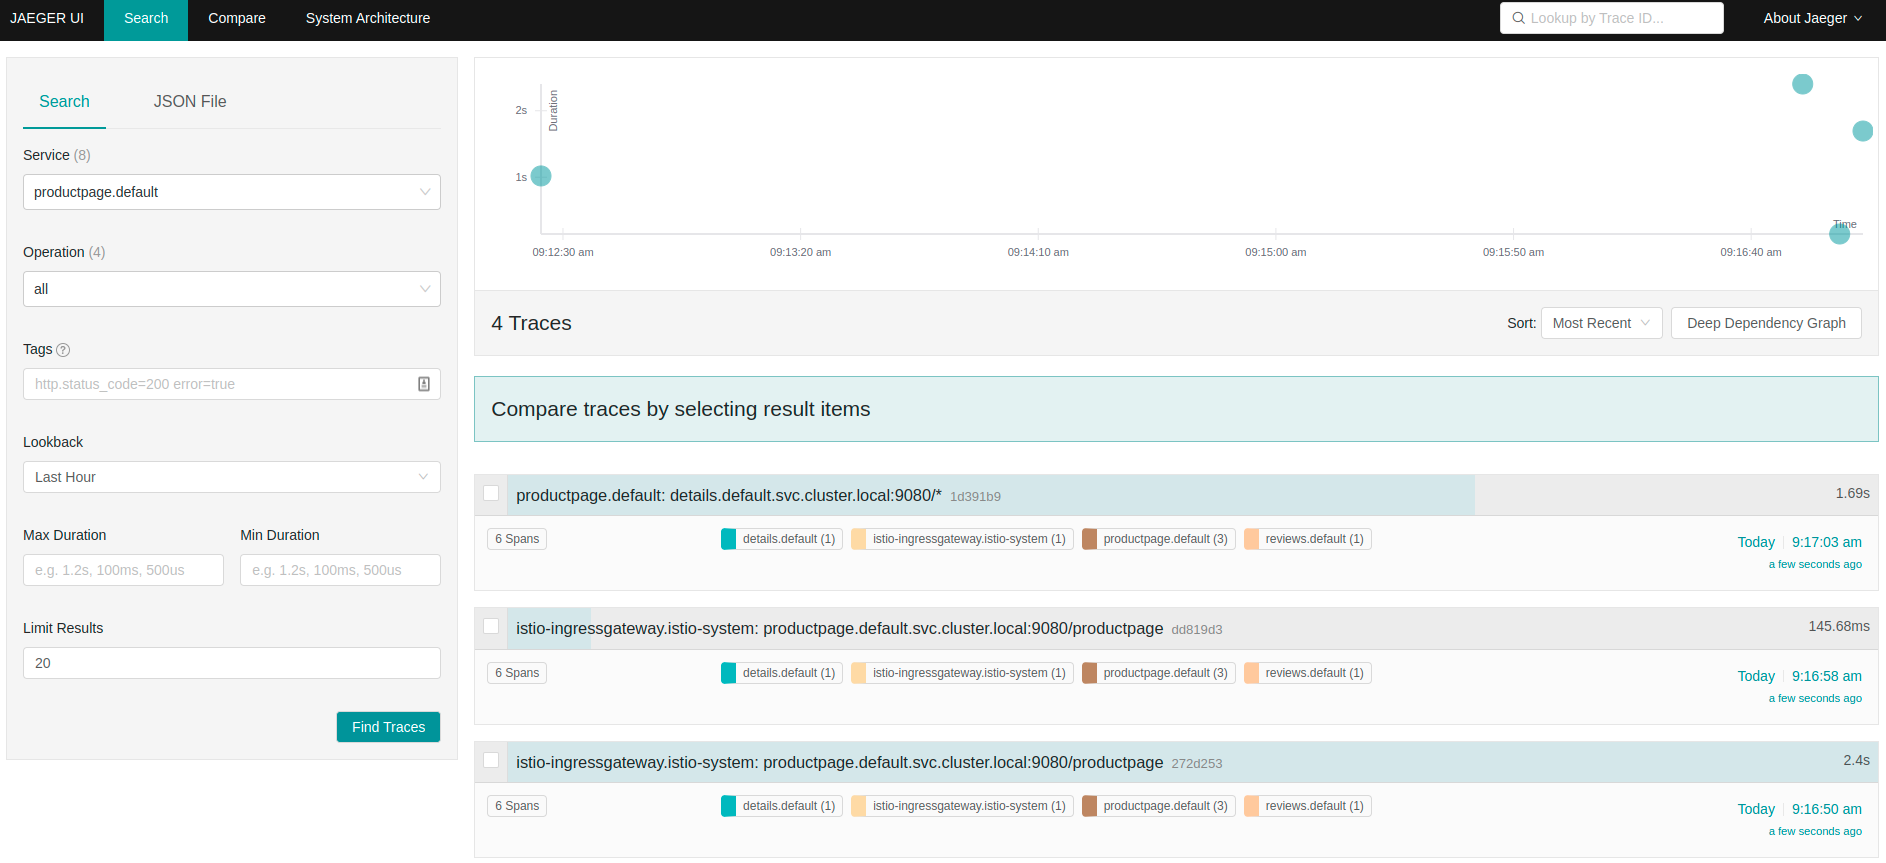
Tracing Dashboard Click on the most recent trace at the top to see the details corresponding to the latest request to
/productpage: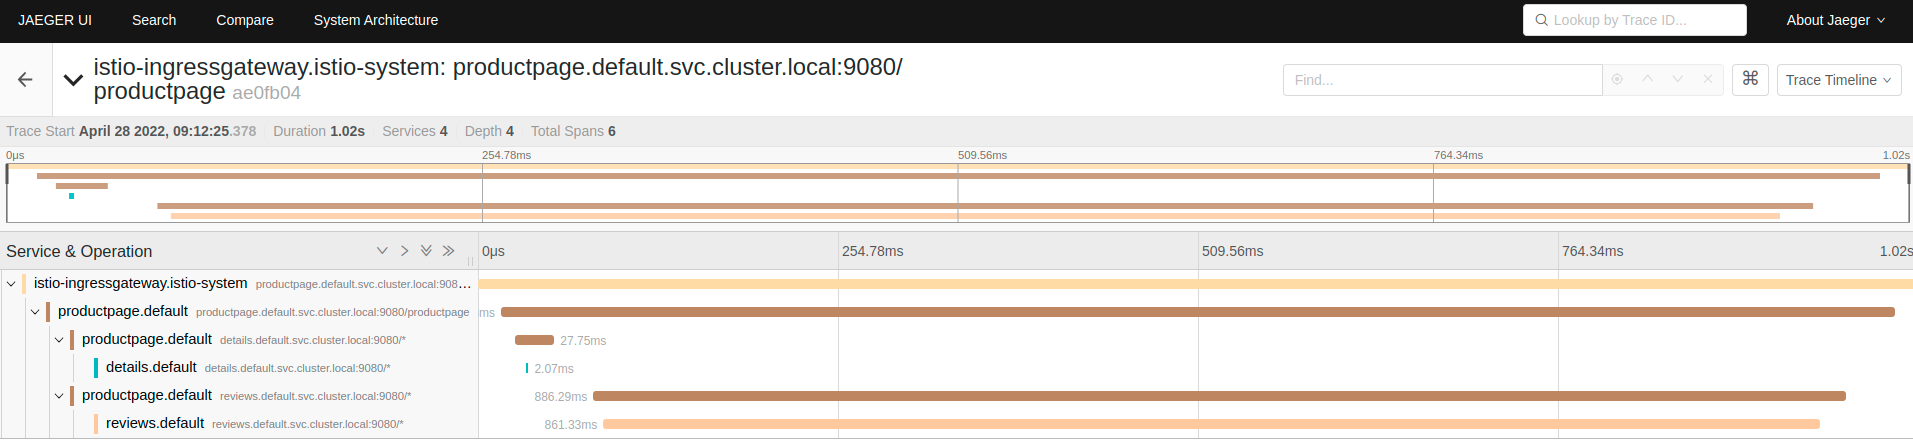
Detailed Trace View The trace is comprised of a set of spans, where each span corresponds to a Bookinfo service, invoked during the execution of a
/productpagerequest, or internal Istio component, for example:istio-ingressgateway.
As you also configured logging exporter in OpenTelemetry Collector, you can see traces in the logs as well:
$ kubectl -n istio-system logs deploy/opentelemetry-collector
Cleanup
Remove any
istioctlprocesses that may still be running using control-C or:$ killall istioctlIf you are not planning to explore any follow-on tasks, refer to the Bookinfo cleanup instructions to shutdown the application.
Remove the
Jaegeraddon:$ kubectl delete -f https://raw.githubusercontent.com/istio/istio/release-1.22/samples/addons/jaeger.yamlRemove the
OpenTelemetry Collector:$ kubectl delete -n istio-system cm opentelemetry-collector $ kubectl delete -n istio-system svc opentelemetry-collector $ kubectl delete -n istio-system deploy opentelemetry-collectorRemove, or set to
"", themeshConfig.extensionProvidersandmeshConfig.defaultProviderssetting in your Istio install configuration.Remove the telemetry resource:
$ kubectl delete telemetries.telemetry.istio.io -n istio-system mesh-default