Verify mutual TLS is enabled
Once you have added applications to an ambient mesh, you can easily validate mTLS is enabled among your workloads using one or more of the methods below:
Validate mTLS using workload’s ztunnel configurations
Using the convenient istioctl ztunnel-config workloads command, you can view if your workload is configured to send and accept HBONE traffic via the value for the PROTOCOL column. For example:
$ istioctl ztunnel-config workloads
NAMESPACE    POD NAME                                IP         NODE                     WAYPOINT PROTOCOL
default      details-v1-857849f66-ft8wx              10.42.0.5  k3d-k3s-default-agent-0  None     HBONE
default      kubernetes                              172.20.0.3                          None     TCP
default      productpage-v1-c5b7f7dbc-hlhpd          10.42.0.8  k3d-k3s-default-agent-0  None     HBONE
default      ratings-v1-68d5f5486b-b5sbj             10.42.0.6  k3d-k3s-default-agent-0  None     HBONE
default      reviews-v1-7dc5fc4b46-ndrq9             10.42.1.5  k3d-k3s-default-agent-1  None     HBONE
default      reviews-v2-6cf45d556b-4k4md             10.42.0.7  k3d-k3s-default-agent-0  None     HBONE
default      reviews-v3-86cb7d97f8-zxzl4             10.42.1.6  k3d-k3s-default-agent-1  None     HBONE
Having HBONE configured on your workload doesn’t mean your workload will reject any plaintext traffic. If you want your workload to reject plaintext traffic, create a PeerAuthentication policy with mTLS mode set to STRICT for your workload.
Validate mTLS from metrics
If you have installed Prometheus, you can set up port-forwarding and open the Prometheus UI by using the following command:
$ istioctl dashboard prometheusIn Prometheus, you can view the values for the TCP metrics. First, select Graph and enter the a metric such as: istio_tcp_connections_opened_total, istio_tcp_connections_closed_total, istio_tcp_received_bytes_total, or istio_tcp_sent_bytes_total. Lastly, click Execute. The data will contain entries such as:
istio_tcp_connections_opened_total{
  app="ztunnel",
  connection_security_policy="mutual_tls",
  destination_principal="spiffe://cluster.local/ns/default/sa/bookinfo-details",
  destination_service="details.default.svc.cluster.local",
  reporter="source",
  request_protocol="tcp",
  response_flags="-",
  source_app="curl",
  source_principal="spiffe://cluster.local/ns/default/sa/curl",source_workload_namespace="default",
  ...}
Validate that the connection_security_policy value is set to mutual_tls along with the expected source and destination identity information.
Validate mTLS from logs
You can also view either the source or destination ztunnel log to confirm mTLS is enabled, along with peer identities. Below is an example of the source ztunnel’s log for a request from the curl service to the details service:
2024-08-21T15:32:05.754291Z info access connection complete src.addr=10.42.0.9:33772 src.workload="curl-7656cf8794-6lsm4" src.namespace="default"
src.identity="spiffe://cluster.local/ns/default/sa/curl" dst.addr=10.42.0.5:15008 dst.hbone_addr=10.42.0.5:9080 dst.service="details.default.svc.cluster.local"
dst.workload="details-v1-857849f66-ft8wx" dst.namespace="default" dst.identity="spiffe://cluster.local/ns/default/sa/bookinfo-details"
direction="outbound" bytes_sent=84 bytes_recv=358 duration="15ms"
Validate the src.identity and dst.identity values are correct. They are the identities used for the mTLS communication among the source and destination workloads. Refer to the verifying ztunnel traffic through logs section for more details.
Validate with Kiali dashboard
If you have Kiali and Prometheus installed, you can visualize your workload communication in the ambient mesh using Kiali’s dashboard. You can see if the connection between any workloads has the padlock icon to validate that mTLS is enabled, along with the peer identity information:
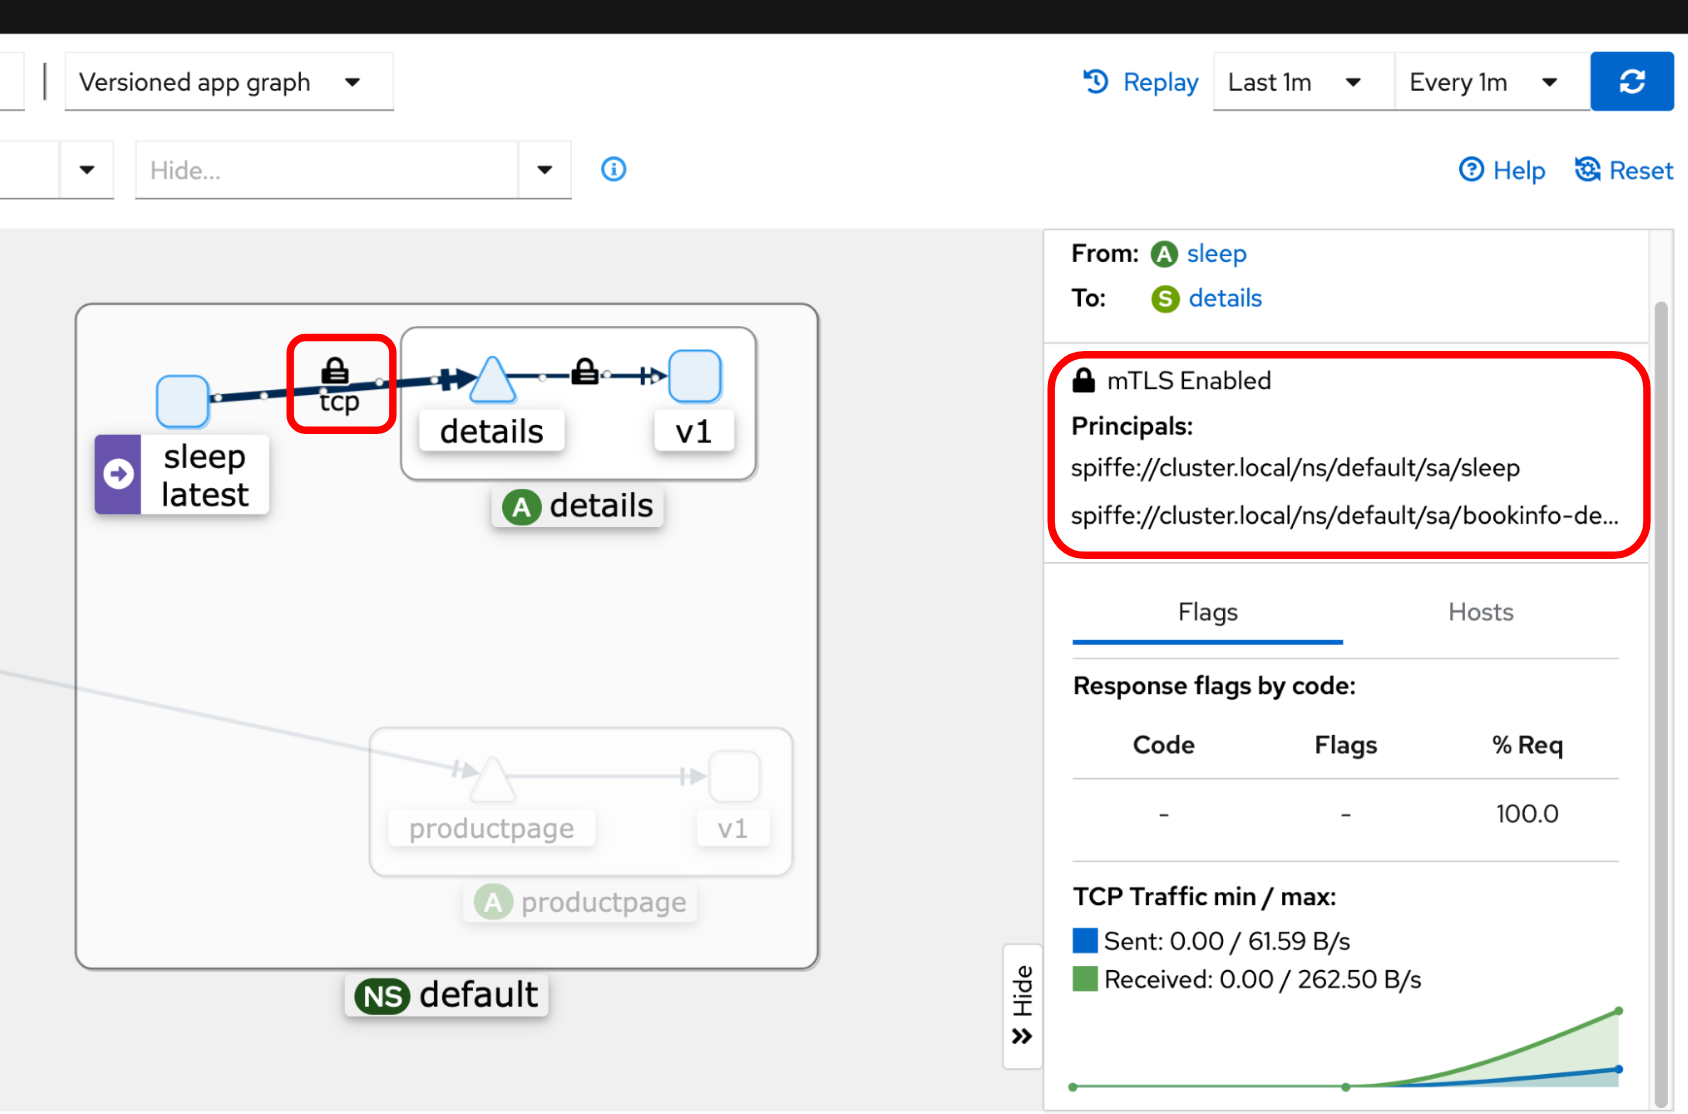
Refer to the Visualize the application and metrics document for more details.
Validate with tcpdump
If you have access to your Kubernetes worker nodes, you can run the tcpdump command to capture all traffic on the network interface, with optional focusing the application ports and HBONE port. In this example, port 9080 is the details service port and 15008 is the HBONE port:
$ tcpdump -nAi eth0 port 9080 or port 15008You should see encrypted traffic from the output of the tcpdump command.
If you don’t have access to the worker nodes, you may be able to use the netshoot container image to easily run the command:
$ POD=$(kubectl get pods -l app=details -o jsonpath="{.items[0].metadata.name}")
$ kubectl debug $POD -i --image=nicolaka/netshoot -- tcpdump -nAi eth0 port 9080 or port 15008