Kiali Dashboard for Ambient Multi-network
Follow this guide to deploy multicluster-aware Kiali in multi-network ambient deployment to view how the traffic flows between the clusters.
Before proceeding, be sure to complete the steps under before you begin, multicluster installation guides and verify your deployment.
In this guide we will start with deploying federated Prometheus instance to aggregate metrics from all clusters together. We then proceed to deploy customized Kiali instance that connects to all the clusters and presents a unified view of the mesh traffic.
Prepare for Kiali Deployment
We will install customized Prometheus and Kiali into a separate namespace, so let’s start with creating the namespace in both clusters:
$ kubectl --context="${CTX_CLUSTER1}" create namespace kiali
$ kubectl --context="${CTX_CLUSTER2}" create namespace kiali
We will also use helm to deploy Kiali, so lets add relevant Helm repositories:
$ helm repo add kiali https://kiali.org/helm-chartsFederated Prometheus
Istio provides a basic sample installation to quickly get Prometheus up and running in single cluster deployments - we will use that to install Prometheus in each cluster. Then we will deploy another Prometheus instance that will scrape Prometheus in each cluster and aggregate metrics together.
To be able to scrape Prometheus in remote cluster we will expose Prometheus instance via an Ingress Gateway.
Deploy Prometheus in Each Cluster
$ kubectl --context="${CTX_CLUSTER1}" apply -f https://raw.githubusercontent.com/istio/istio/release-1.29/samples/addons/prometheus.yaml
$ kubectl --context="${CTX_CLUSTER2}" apply -f https://raw.githubusercontent.com/istio/istio/release-1.29/samples/addons/prometheus.yaml
The commands above will install Prometheus that collects local cluster metrics from waypoints and ztunnels.
Expose Prometheus
The next step is to expose Prometheus instances externally, so that they can be scraped:
$ cat <<EOF | kubectl --context="${CTX_CLUSTER1}" apply -f -
apiVersion: gateway.networking.k8s.io/v1
kind: Gateway
metadata:
  name: prometheus-gateway
  namespace: istio-system
spec:
  gatewayClassName: istio
  listeners:
  - name: http
    port: 9090
    protocol: HTTP
    allowedRoutes:
      namespaces:
        from: Same
---
apiVersion: gateway.networking.k8s.io/v1
kind: HTTPRoute
metadata:
  name: prometheus
  namespace: istio-system
spec:
  parentRefs:
  - name: prometheus-gateway
    port: 9090
  rules:
  - matches:
    - path:
        type: PathPrefix
        value: /
    backendRefs:
    - name: prometheus
      port: 9090
EOF
We will do the same in the second cluster as well:
$ cat <<EOF | kubectl --context="${CTX_CLUSTER2}" apply -f -
apiVersion: gateway.networking.k8s.io/v1
kind: Gateway
metadata:
  name: prometheus-gateway
  namespace: istio-system
spec:
  gatewayClassName: istio
  listeners:
  - name: http
    port: 9090
    protocol: HTTP
    allowedRoutes:
      namespaces:
        from: Same
---
apiVersion: gateway.networking.k8s.io/v1
kind: HTTPRoute
metadata:
  name: prometheus
  namespace: istio-system
spec:
  parentRefs:
  - name: prometheus-gateway
    port: 9090
  rules:
  - matches:
    - path:
        type: PathPrefix
        value: /
    backendRefs:
    - name: prometheus
      port: 9090
EOF
Aggregate Metrics
With cluster-local Prometheus instances up and running, we can now setup another Prometheus instance that will scrape them to collect metrics from both clusters in one place. We will start by creating a config for the new Prometheus instance that will point it to the cluster-local Prometheus instances to scrape:
$ TARGET1="$(kubectl --context="${CTX_CLUSTER1}" get gtw prometheus-gateway -n istio-system -o jsonpath='{.status.addresses[0].value}')"
$ TARGET2="$(kubectl --context="${CTX_CLUSTER2}" get gtw prometheus-gateway -n istio-system -o jsonpath='{.status.addresses[0].value}')"
$ cat <<EOF > prometheus.yml
global:
  scrape_interval: 15s

scrape_configs:
  - job_name: 'federate-1'
    honor_labels: true
    metrics_path: '/federate'
    params:
      'match[]':
        - '{job="kubernetes-pods"}'
    static_configs:
      - targets:
        - '${TARGET1}:9090'
        labels:
          cluster: 'cluster1'
  - job_name: 'federate-2'
    honor_labels: true
    metrics_path: '/federate'
    params:
      'match[]':
        - '{job="kubernetes-pods"}'
    static_configs:
      - targets:
        - '${TARGET2}:9090'
        labels:
          cluster: 'cluster2'
EOF
$ kubectl --context="${CTX_CLUSTER1}" create configmap prometheus-config -n kiali --from-file prometheus.yml
We now can use that config to deploy a new Prometheus instance:
$ cat <<EOF | kubectl --context="${CTX_CLUSTER1}" apply -f - -n kiali
apiVersion: apps/v1
kind: Deployment
metadata:
  name: prometheus
spec:
  replicas: 1
  selector:
    matchLabels:
      app: prometheus
  template:
    metadata:
      labels:
        app: prometheus
    spec:
      containers:
        - name: prometheus
          image: prom/prometheus
          ports:
            - containerPort: 9090
          volumeMounts:
            - name: config-volume
              mountPath: /etc/prometheus
      volumes:
        - name: config-volume
          configMap:
            name: prometheus-config
            defaultMode: 420
---
apiVersion: v1
kind: Service
metadata:
  name: prometheus
  labels:
    app: prometheus
    service: prometheus
spec:
  ports:
  - port: 9090
    name: http
  selector:
    app: prometheus
EOF
Once deployed the new Prometheus instance will start scraping metrics from both clusters.
Verify Federated Prometheus
To test we can generate some traffic by running curl several times to reach backends in both
clusters:
$ kubectl exec --context="${CTX_CLUSTER1}" -n sample -c curl \
    "$(kubectl get pod --context="${CTX_CLUSTER1}" -n sample -l \
    app=curl -o jsonpath='{.items[0].metadata.name}')" \
    -- curl -sS helloworld.sample:5000/hello
Hello version: v2, instance: helloworld-v2-758dd55874-6x4t8
Hello version: v1, instance: helloworld-v1-86f77cd7bd-cpxhv
...Then we can query Prometheus using curl to see if we have metrics reported from all the clusters:
$ kubectl exec --context="${CTX_CLUSTER1}" -n sample -c curl \
    "$(kubectl get pods ---context="${CTX_CLUSTER1}" -n sample -l \
    app=curl -o jsonpath='{.items[0].metadata.name}')" \
    -- curl -s prometheus.kiali:9090/api/v1/query?query=istio_tcp_received_bytes_total | jq '.'
If curl request reached backends in both clusters, for istio_tcp_received_bytes_total metric
reported by ztunnel you should be able to see values from both clusters in the output:
{
  "status": "success",
  "data": {
    "resultType": "vector",
    "result": [
      {
        "metric": {
          "__name__": "istio_tcp_received_bytes_total",
          ...
          "app": "ztunnel",
          ...
          "cluster": "cluster2",
          ...
          "destination_canonical_revision": "v2",
          ...
          "destination_canonical_service": "helloworld",
          ...
        },
        "value": [
          1770660628.007,
          "5040"
        ]
      },
      ...
      {
        "metric": {
          "__name__": "istio_tcp_received_bytes_total",
          ...
          "app": "ztunnel",
          ...
          "cluster": "cluster1",
          ...
          "destination_canonical_revision": "v1",
          ...
          "destination_canonical_service": "helloworld",
          ...
        },
        "value": [
          1770660628.007,
          "4704"
        ]
      },
      ...
    ]
  }
}
Deploy Multicluster Kiali
Prepare Remote Cluster
We will only deploy Kiali properly in one cluster - cluster1, however we still need to prepare
cluster2, so that Kiali can access resources there. In order to do that we will start with
deploying Kiali Operator:
$ helm --kube-context="${CTX_CLUSTER2}" install --namespace kiali kiali-operator kiali/kiali-operator --waitOnce we have Kiali Operator deployed, we can prepare all the needed service accounts, role bindings and tokens. Kiali Operator will create the service account and role bindings, but we will have to create the token for the service account manually:
$ cat <<EOF | kubectl --context="${CTX_CLUSTER2}" apply -f - -n kiali
apiVersion: kiali.io/v1alpha1
kind: Kiali
metadata:
  name: kiali
spec:
  auth:
    strategy: "anonymous"
  deployment:
    remote_cluster_resources_only: true
EOF
$ kubectl --context="${CTX_CLUSTER2}" wait --timeout=5m --for=condition=Successful kiali kiali -n kiali
$ cat <<EOF | kubectl --context="${CTX_CLUSTER2}" apply -f - -n kiali
apiVersion: v1
kind: Secret
metadata:
  name: kiali
  namespace: kiali
  annotations:
    kubernetes.io/service-account.name: kiali-service-account
type: kubernetes.io/service-account-token
EOF
Deploy Kiali
With remote cluster ready, we can now deploy Kiali server. We will need to configure Kiali with the address of the Prometheus endpoint and the secret to access the remote cluster. As before we will start with deploying Kiali Operator:
$ helm --kube-context="${CTX_CLUSTER1}" install --namespace kiali kiali-operator kiali/kiali-operator --waitKiali project provides a script that we can use to create a secret need to access remote cluster resources:
$ curl -L -o kiali-prepare-remote-cluster.sh https://raw.githubusercontent.com/kiali/kiali/master/hack/istio/multicluster/kiali-prepare-remote-cluster.sh
$ chmod +x kiali-prepare-remote-cluster.sh
$ ./kiali-prepare-remote-cluster.sh \
    --kiali-cluster-context "${CTX_CLUSTER1}" \
    --remote-cluster-context "${CTX_CLUSTER2}" \
    --view-only false \
    --process-kiali-secret true \
    --process-remote-resources false \
    --kiali-cluster-namespace kiali \
    --remote-cluster-namespace kiali \
    --kiali-resource-name kiali \
    --remote-cluster-name cluster2
With remote secret ready, we can now deploy Kiali server:
$ cat <<EOF | kubectl --context="${CTX_CLUSTER1}" apply -f - -n kiali
apiVersion: kiali.io/v1alpha1
kind: Kiali
metadata:
  name: kiali
spec:
  auth:
    strategy: "anonymous"
  external_services:
    prometheus:
      url: http://prometheus.kiali:9090
    grafana:
      enabled: false
  server:
    web_root: "/kiali"
EOF
$ kubectl --context="${CTX_CLUSTER1}" wait --timeout=5m --for=condition=Successful kiali kiali -n kiali
Once the Kiali server is running, we can forward a local port to Kiali deployment to access it locally:
$ kubectl --context="${CTX_CLUSTER1}" port-forward svc/kiali 20001:20001 -n kialiOpen Kiali dashboard in the browser, navigate to the traffic graph, and select “sample” namespace from the “Select Namespaces” drop-down. You should see how traffic flows between clusters:
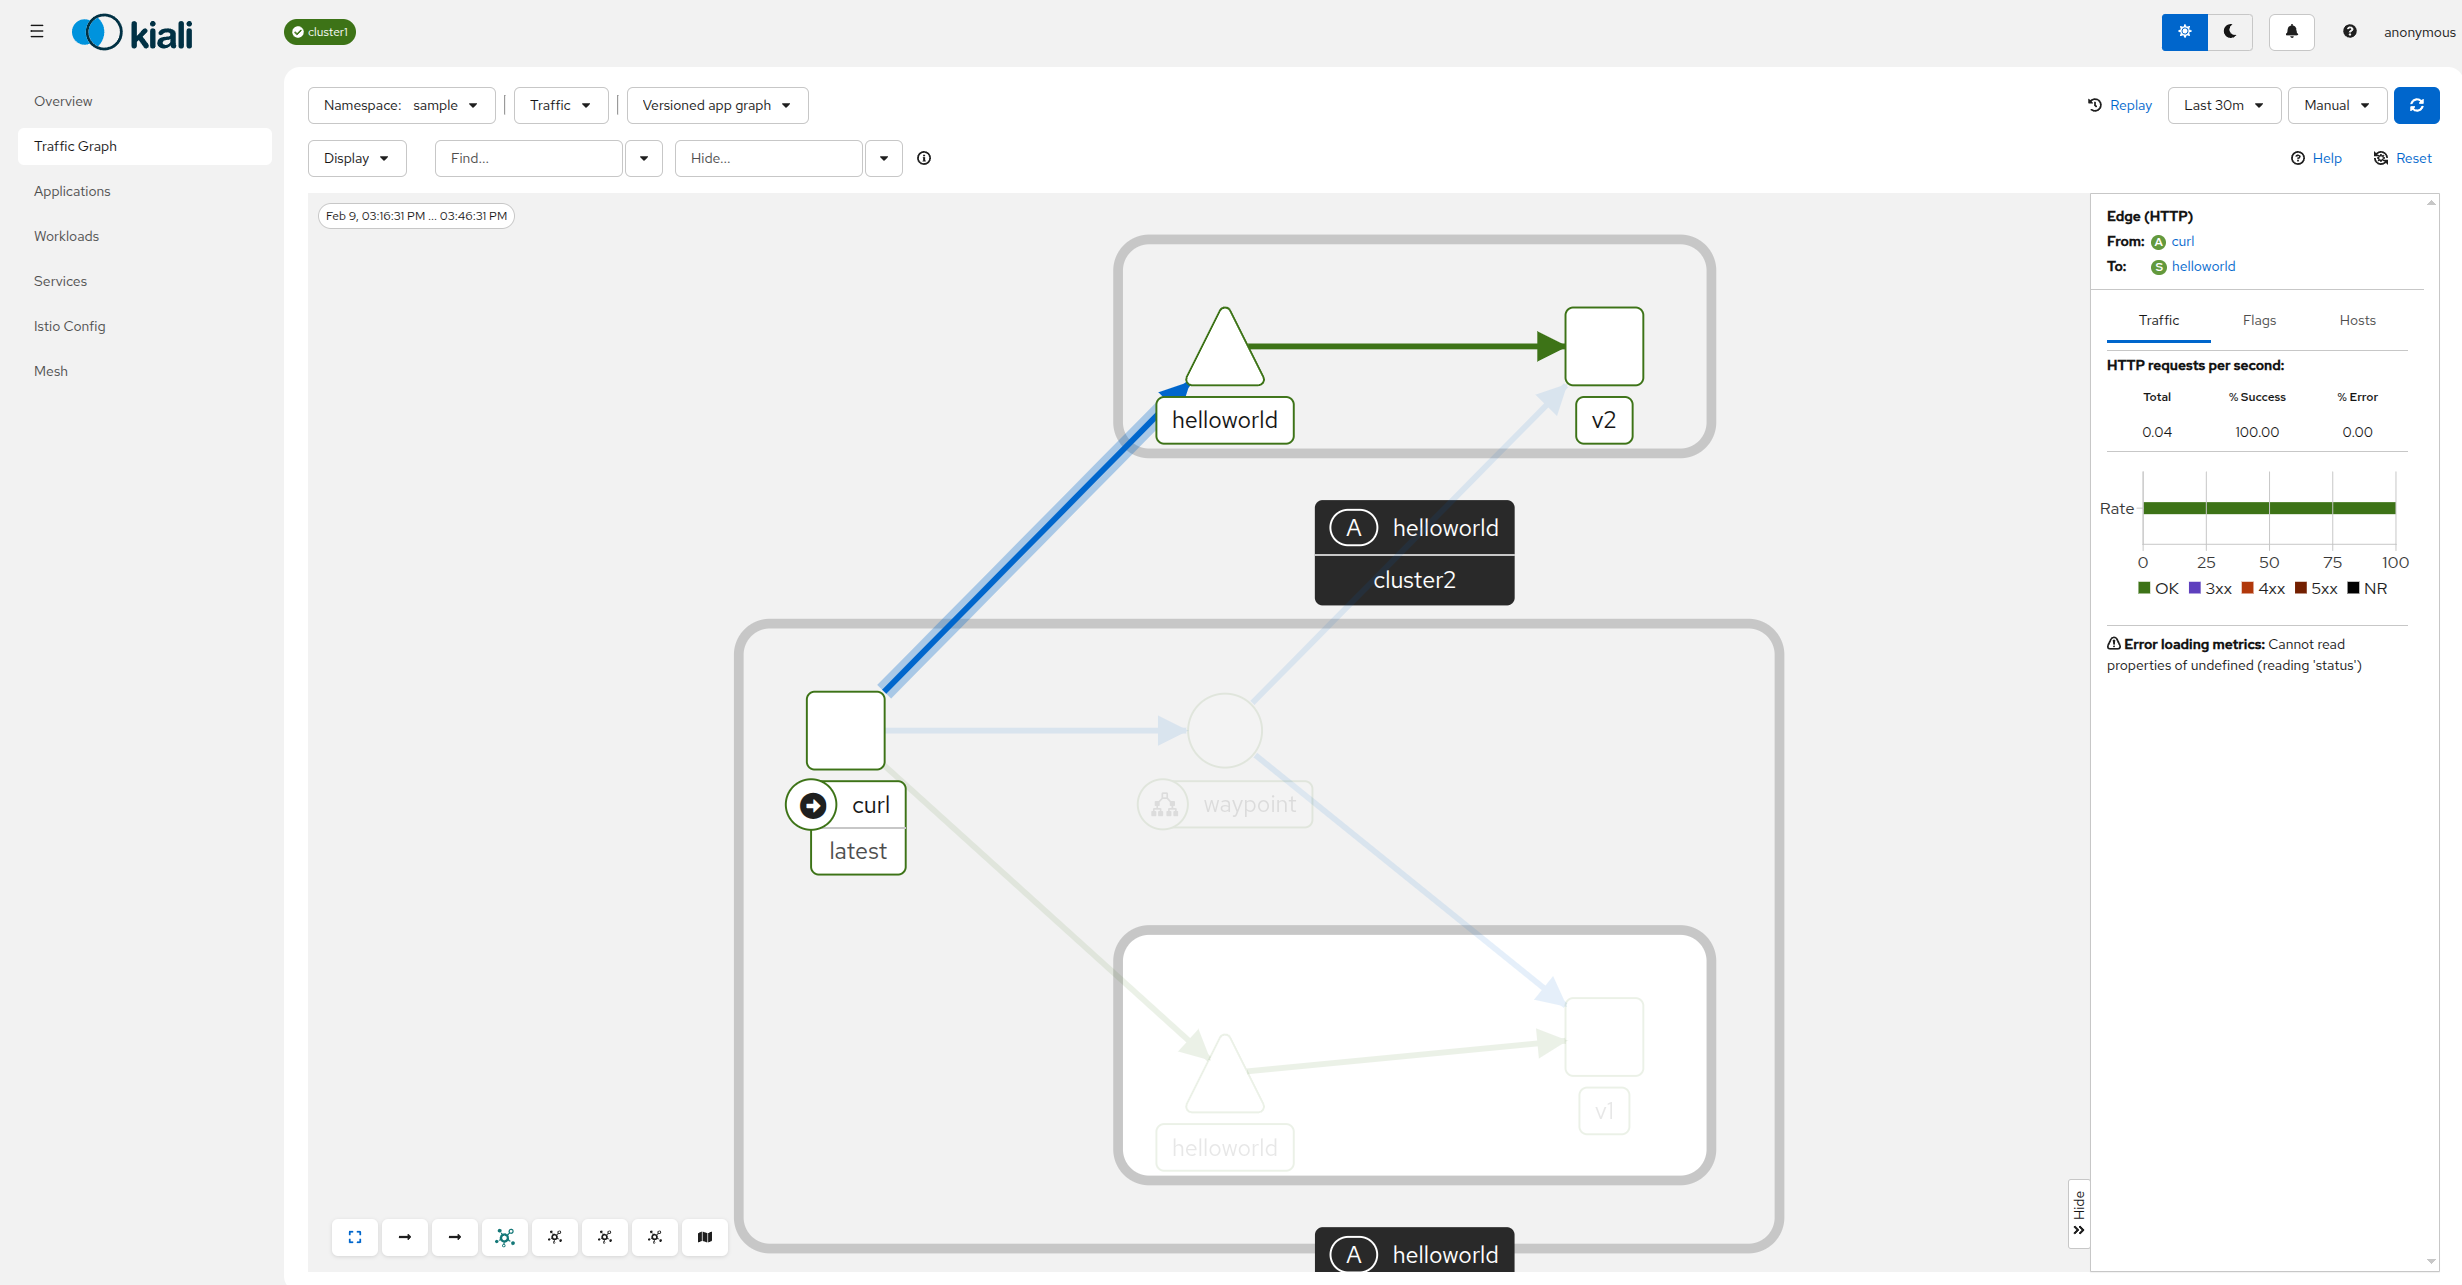
Congratulations! You successfully installed Kiali for multicluster ambient deployment.
Cleanup Kiali and Prometheus
To delete Kiali, start by deleting Kiali custom resource:
$ kubectl --context="${CTX_CLUSTER1}" delete kiali kiali -n kiali
$ kubectl --context="${CTX_CLUSTER2}" delete kiali kiali -n kiali
Kiali Operator will stop Kiali server once the custom resource is deleted. If you want to additionally delete Kiali Operator you can do that as well:
$ helm --kube-context="${CTX_CLUSTER1}" uninstall --namespace kiali kiali-operator
$ helm --kube-context="${CTX_CLUSTER2}" uninstall --namespace kiali kiali-operator
Finally, you can delete custom resource definitions:
$ kubectl --context="${CTX_CLUSTER1}" delete crd kialis.kiali.ioIf you don’t need cluster-local Prometheus instances, you can delete them as well:
$ kubectl --context="${CTX_CLUSTER1}" delete -f https://raw.githubusercontent.com/istio/istio/release-1.29/samples/addons/prometheus.yaml
$ kubectl --context="${CTX_CLUSTER2}" delete -f https://raw.githubusercontent.com/istio/istio/release-1.29/samples/addons/prometheus.yaml